
See Your Total Asset Allocation Across All Accounts in One View
You probably have more than one account by now: a 401(k), an IRA or two, maybe a taxable brokerage account. Any one of them might hold several different funds or positions that serve varied roles, like growth, stability, or income. Each account shows you its own mix, but none of them shows the total. Your total asset allocation across accounts is every stock, bond, and cash position you hold, no matter which account it sits in, combined into one tally.
Each institution only sees what it holds. Your 401(k) provider can’t see your IRA, and your brokerage doesn’t know your workplace plan details. Seeing the full picture means gathering every statement and sorting each fund into an asset class. Then you calculate what percentage of the total each asset class represents.
The Boldin Planner’s Investments feature pulls it all into one place. It sorts all of your positions into clear asset classes, so you can see where you’re overweighted, underweighted, or paying more in fees than you realized, and decide what you want to do about it.

What Does Total Asset Allocation Mean?
Total asset allocation mix is the percentage of your money in stocks, bonds, cash, and other assets, combined across every account instead of viewed one account at a time.
A target-date fund folds stocks and bonds into a single position, which is exactly why looking at any one fund or account in isolation won’t tell you your real split. Cash can sit in a settlement account you forgot existed. Add it all up by hand across four or five statements and you can see why most people never quite finish the math.
We built this for people getting close to retirement who want a clear read on their risk exposure, active investors trying to rebalance or catch cash drag before it costs them, and anyone with money scattered across old 401(k)s and IRAs who just wants to see their total stock position.
Why a Single Account View Hides Asset Concentration Risk
Two accounts that each look balanced on their own can still leave you concentrated in the same stocks twice over. Neither statement alone would show you that.
Say your 401(k) is 70% stock and your rollover IRA is also 70% stock. That doesn’t mean that your combined split is automatically 70%. It depends on how much sits in each account. If both funds happen to hold a lot of the same large tech names, your real concentration risk is higher than either statement alone would suggest.
The SEC’s guide to asset allocation explains that splitting your money among different assets, like stocks and bonds, is what drives most of your portfolio risk and return. This is all the more true when your investments are spread across multiple accounts, but the calculations get harder to see.
How to Classify Your Holdings Into Asset Classes
Every position you hold falls into a category based on what it is and how it behaves: a large-cap stock fund, a municipal bond, cash sitting in a settlement account. Sorting everything this way is what makes a real asset allocation possible.
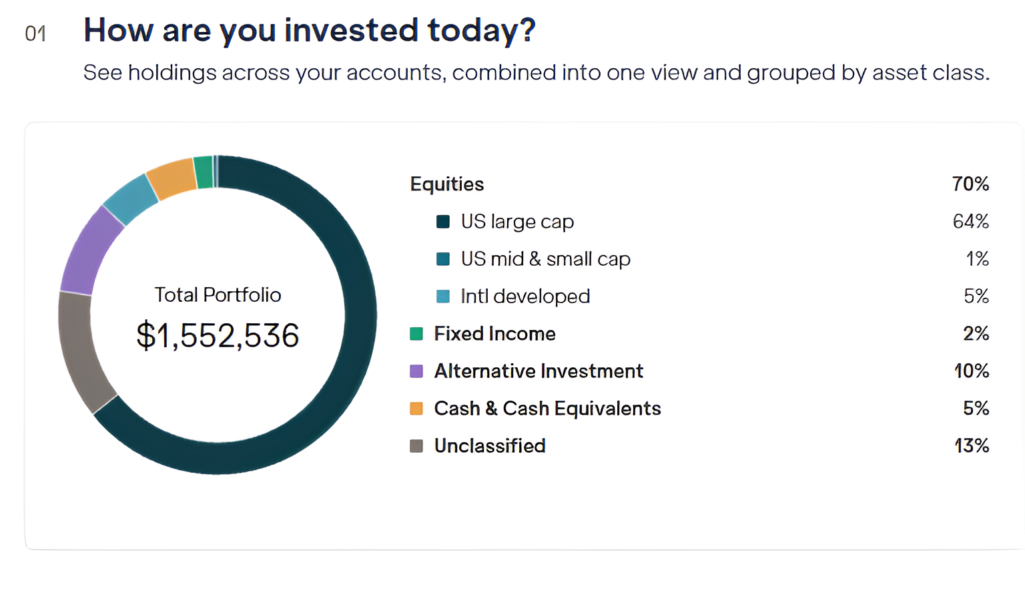
Boldin sorts your portfolio holdings into 8 asset classes
| Asset Class | What Lands Here |
| US Large Cap Equities | Large US companies |
| US Mid/Small Cap Equities | Mid and small US companies |
| Int’l Developed Equities | Stocks in developed markets outside the US |
| Int’l Emerging Equities | Stocks in emerging markets |
| Fixed Income | Bonds and bond funds |
| Alternative Assets | Real estate and commodities |
| Cash & Cash Equivalents | Cash, money market funds, and similar holdings |
| Unclassified | Employer plan funds with no public ticker, private holdings, crypto, and other positions Boldin can’t confidently map yet |
Positions that fall into Unclassified still count toward your total portfolio value. They just aren’t attributed to a class yet.
Diversification works within each asset class
Diversification is a related idea: how spread out your investments are within each class. Two accounts can each show 40% Fixed Income and still carry very different risk. One might hold a dozen investment-grade bonds from different issuers. The other might sit entirely in one long-duration Treasury fund. Boldin’s asset classes show you the allocation side of that picture. How spread out you are within each class is worth checking on your own.
How Boldin Compares to Tracking Your Portfolio Yourself
A dashboard from a brokerage like Vanguard or Fidelity only shows what’s held at that one institution, and a spreadsheet only stays accurate as long as you keep updating it by hand. What most people want is closer to a full portfolio x-ray: every position in every account, all at once. That’s what an asset allocation tool or portfolio analyzer is supposed to deliver.
| Brokerage Dashboard (Vanguard, Fidelity, etc.) | Manual Spreadsheet | Boldin Investments | |
| Covers accounts at other institutions | No | Yes, if you keep it current | Yes |
| Updates on its own | Only for that institution | No | Yes, for connected accounts |
| Consistent classification across holdings | Varies by institution | Depends on you | Same 8 classes for everything |
| Exportable | Rarely | Already yours | Yes, CSV |
Each approach costs you something different. A brokerage dashboard is accurate but incomplete, and a spreadsheet can be complete but decays the moment you stop maintaining it.
How Your Asset Allocation Across Accounts Compares to Your Risk Profile
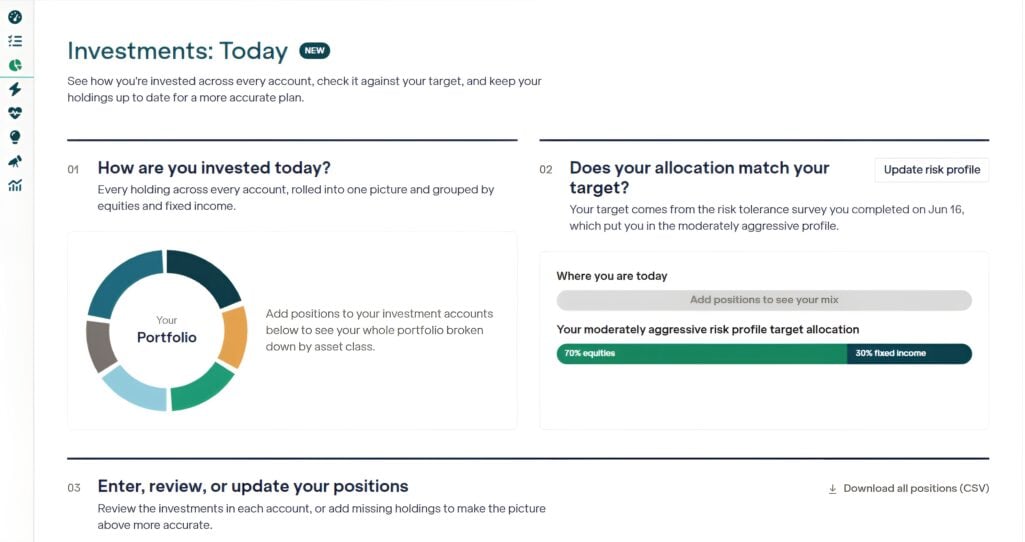
Boldin compares your actual investments to the target from your Risk Tolerance Survey, so you can see whether you’re running heavier or lighter on stocks than your own profile suggests.
The seven-question survey covers your withdrawal timeline, income sources, and how you’ve behaved during past downturns rather than how you think you’d react. It sorts you into one of five profiles, each with a sample stocks-vs-bonds split and a nominal return assumption:
| Risk Profile | Sample Stock/Bond Split | Nominal Return Assumption |
| Conservative | 30% / 70% | 5.92% |
| Mod. Conservative | 40% / 60% | 6.64% |
| Moderate | 60% / 40% | 8.08% |
| Mod. Aggressive | 70% / 30% | 8.80% |
| Aggressive | 90% / 10% | 10.25% |
These sample splits are a reference point, and none of this updates your plan or rate of return on its own. The comparison is informational. What you do with it is up to you.
PlannerPlus users can find the survey under Account Settings, in the Risk Tolerance tab.
How Your Total Asset Allocation View Flags Rebalancing Drift
Your allocation view flags rebalancing drift when your current class percentages move several points away from your target mix, especially in equities. That drift is easy to miss one account at a time. Each account might still look reasonable on its own, even as your combined equity exposure climbs past what your target calls for. Seeing every account together is what makes the drift visible in the first place.
That’s the standard cue to consider rebalancing. A common way to rebalance without triggering a taxable event in a brokerage account is directing new contributions toward whatever’s underweight, rather than selling what’s overweight.
How to Catch Cash Drag Before It Costs You
Cash drag is the return you lose when money sits uninvested longer than it needs to. A settlement account or money market fund pays a fraction of what a diversified portfolio earns over time. Every extra month adds to that gap. It’s rarely intentional. Contributions land in a default cash position and never quite get invested, or an old account rolls over and sits untouched while you decide what to do with it.
Watch your Cash & Cash Equivalents percentage against your target mix. A share that keeps climbing is usually a sign that cash is accumulating faster than it’s being put to work. A more useful benchmark than a generic target is what you’ve said you need on hand for near-term spending. Check your cash percentage against that number too.
How to Connect Your Investments to Boldin
The new Investments feature is available on PlannerPlus. You can bring your holdings in one of two ways today, with a third on the way, and the Planner will lay out your allocation.
Connect your accounts and sync daily
Linking an account is the fastest path. Once it’s connected, your positions sync once a day, and any holdings you’d entered by hand for that account get replaced with the live data. You can also open a linked account’s allocation in the Planner straight from Assets & Debts. Look for the “View Investments” icon next to that account, then select “See Total Holdings.”
Add your positions manually
For accounts you can’t link, enter the ticker and the dollar amount yourself. Boldin classifies the ticker the same way it classifies a connected holding, but the value stays exactly what you typed until you come back and update it. Manual entries don’t get repriced daily the way connected accounts do.
Statement upload is coming soon
You’ll soon be able to skip manual entry entirely. Upload a statement or document, and the Planner will read the positions and check with you before anything changes in your allocation.
Whatever you connect or enter, you can pull it back out just as easily. Select “Download all positions (CSV)” from the Investments page any time you want an export of your allocation data.
Where the Investments Feature Is Headed
We’re expanding what your total asset allocation can deliver in a few directions at once. That includes surfacing what your investments are costing you in fees, flagging cash drag and concentration risk automatically, giving you a path from insights into strategy, and more control over how your holdings are classified.
The goal is simple: the clearer your financial picture, the more useful your plan becomes.
Frequently Asked Questions
Your asset allocation across accounts is the combined mix of everything you hold, stocks, bonds, cash, and beyond, totaled from every account instead of viewed one at a time. A 401(k), an IRA, and a taxable account each carry their own mix, and none of those numbers reflects your actual combined split by itself.
If you’re using the Boldin Planner with your accounts connected, its Investments feature already shows your total asset allocation across accounts like a 401(k) and a rollover IRA.
To calculate your total asset allocation across accounts, list every holding, tag each one by asset class, and weight it by dollar amount rather than by account. Split a fund that’s 60% stock and 40% bond into those two pieces before you add it to anything else, and look up a fund with an unclear split first. It’s the same math a consolidated portfolio view does automatically.
Which of your accounts holds which asset class matters for taxes, a strategy called asset location. Holding higher-growth or income-generating assets in tax-advantaged accounts and more tax-efficient holdings in taxable ones can reduce what you owe over time. Seeing your total asset allocation across accounts is what makes that kind of placement decision possible in the first place.
Cash drag happens when cash held beyond what a financial or retirement plan needs earns far less than it would earn invested. That shortfall compounds over years rather than showing up all at once. It’s most common in retirement accounts, where money can sit in a settlement fund for years without anyone deciding to put it to work.