Economic inequality—the importance of accounting for household size
Economic inequality—the importance of accounting for household size
beng
Thu, 08/20/2026 – 07:21
EST. READ TIME 5 MIN.
A previous essay in this series explained why households, not individuals, are the best unit of measurement when asking questions about poverty and economic wellbeing. This essay explores the changing household size over time and more importantly the need to adjust and account for household size when analyzing wellbeing and inequality.
University of Toronto professor David Foot is famous for his claim that demography explains two-thirds of everything. While the exact magnitude of the impact of demographic changes on our lives is up for debate, there’s no doubt that demography is critically important to a fuller understanding of economic and social phenomena. One obvious example is the role that demography and specifically household size plays in our understanding of economic inequality.
If we rank all the households in Canada by income, which is often used as a proxy for “standard of living,” from top to bottom, we’d find a substantial degree of income inequality. However, all households do not have the same number of people, so whatever income it has is assumed to be shared by all members of the household.
For example, how do we compare the living standard of a household of two people with after-tax income of $33,000 with that of a household of six people, specifically a married couple plus their four children with after-tax income of say $81,000? The household of six has a far higher income but of course that income is shared by many more people. A common way to account for family size when comparing household incomes is what is referred to as the “square root rule.” Basically, this rule of thumb is used to adjust family income to account for its size by dividing the total household income by the square root of the size of the family. In the example above, applying this rule of thumb would result in adjusted income for the two-person household of approximately $23,334 and income of $33,068 for the six-person household. While the larger household still has higher income, it’s much closer to the adjusted income level of the two-person household.
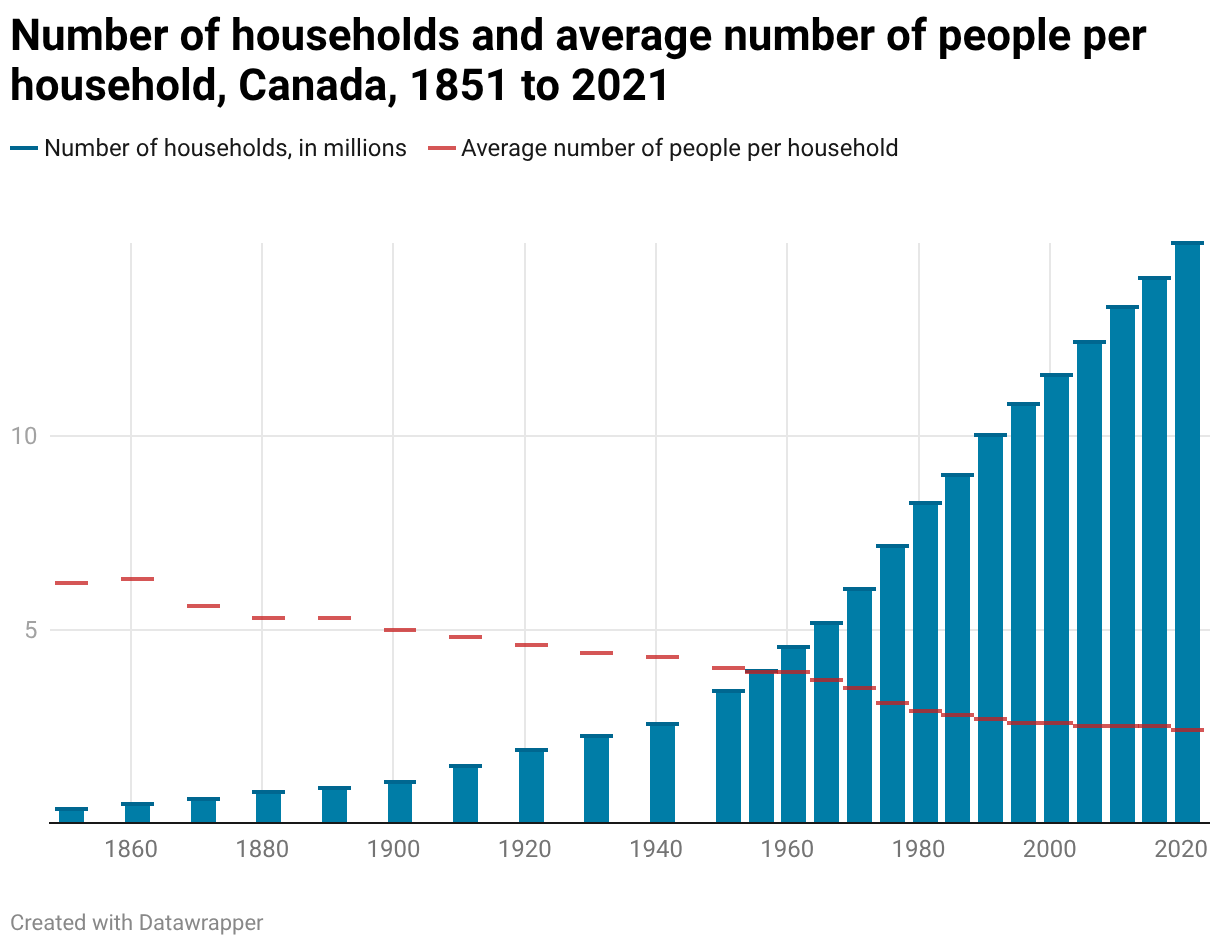
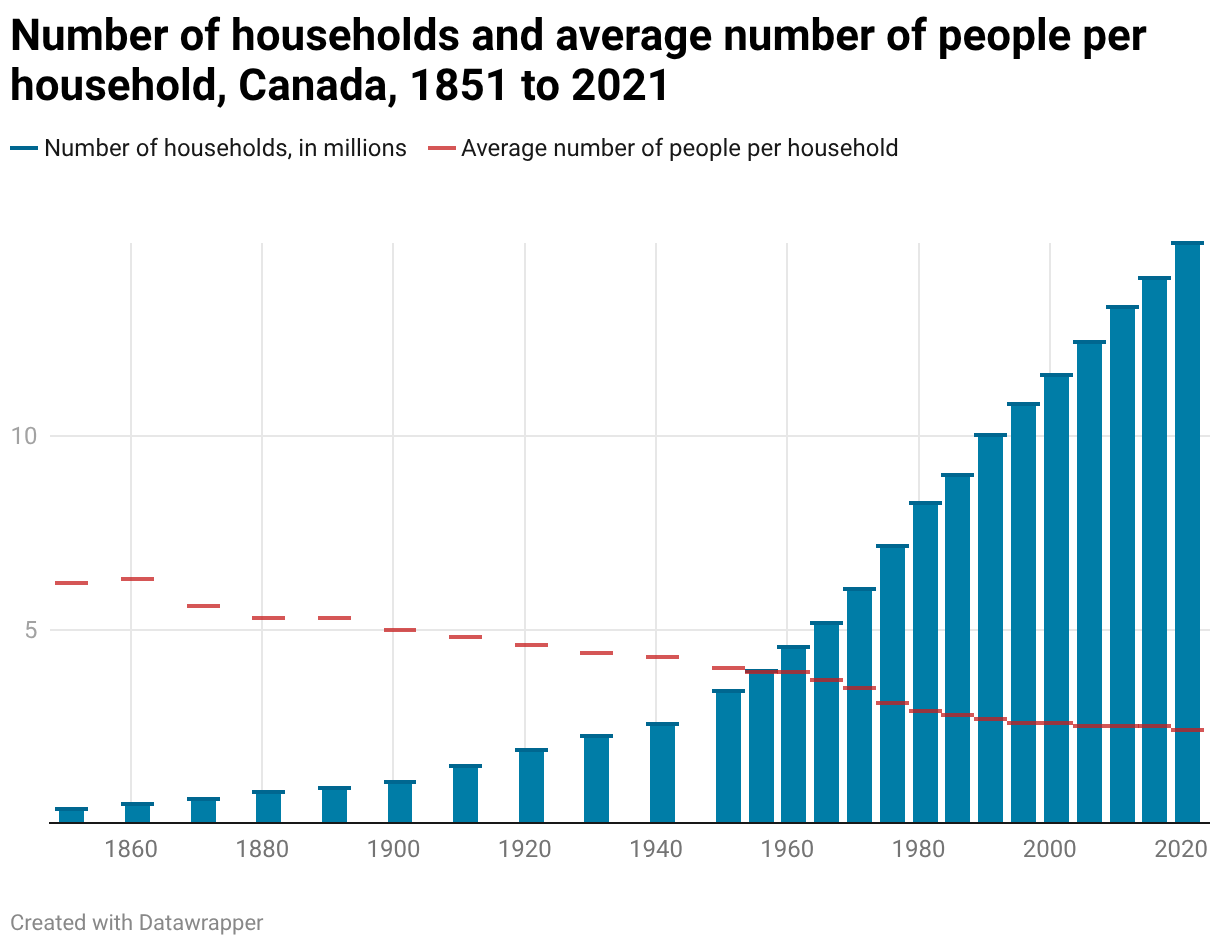
The key insight is that we can’t simply compare the incomes of different households without adjusting for the size of those households. This adjustment is made even more pressing by the fact that the average size of households has been declining over time. The chart below uses census data from Statistics Canada to illustrate both the growth in the number of households and more importantly the change in household size from 1851 to 2021.
Sources:
Statistics Canada (2015). The Shift to Smaller Households Over the Past Century.
Statistics Canada (2022). Number of occupied private dwellings and average household size, Canada, 2001 to 2021.
Calculations by authors with original data work completed by Prof. Christopher Sarlo.
The red line in the chart shows the dramatic decline in household size from 6.2 people in 1851 to 2.4 people in 2021. In the three censuses since 2006, household size has remained stable at about 2.5, but in the latest census, this dropped slightly to 2.4. It should be clear that if we don’t adjust for the size of the family over time, the family income data can be quite misleading regarding what’s happening over time.
Consider a hypothetical example where an average family in 1900 earned the equivalent of a total of $100,000 in income in 2021. Compare that family with one in 2021 that earned $70,000. The immediate reaction is that the family in 1900 is better off and that there’s been a decline in living standards. This conclusion ignores the changing size of the family. If we apply the square root rule explained earlier, which again adjusts for the size of the family, we end up with household income of $44,721 for the family of five in 1900 compared to family income of $45,185 for the family of two in 2021.
It’s worthwhile briefly exploring some of the reasons for this dramatic decline in the size of the average family in Canada. There are three dominant explanations for this sharp decrease in household size. The first relates to the change in the composition of households. Prior to the Second World War, it was not unusual for households to contain two or more families. In the past, children were a parent’s pension plan, so it was common for elderly parents to live with their adult children. As well, two full families sometimes shared a house when each alone could not afford their own house. And some households took on boarders to earn additional income.
The second reason for the decline is the dramatic reduction in fertility rates that often accompanies rising living standards. Women have fewer children with the advent of better birth control methods and increased opportunities for women in the labour market. Finally, the increase in the divorce rate and the rise of single-parent households has contributed to the decline in the average size of households.
Accounting for household size is critically important for any comparison of living standards between households. In any study of poverty, for example, we must either show poverty lines by size of family or else “normalize” incomes by using an “equivalence scale” (like the square root rule) to account for households of different sizes. It’s simply not accurate to compare the incomes of all households, regardless of size, when examining poverty or inequality.
This is the fourth essay of a five-part series on income inequality, which will appear on the Fraser Institute blog. The authors would like to recognize the critical contributions of the authors of the various essays in the 2017 collected series on inequality and poverty as well as Christopher Sarlo’s three decade-plus work on poverty and inequality for the Institute. In addition, the authors thank Christopher Sarlo for his work on early drafts of this series.

By: , and