Definition of ‘income’ matters for measuring income inequality
Definition of ‘income’ matters for measuring income inequality
beng
Wed, 08/26/2026 – 09:33
EST. READ TIME 6 MIN.
Previous essays in this series explored the importance of adjusting for family size, and the sensitivity around using individual versus family income when thinking about and analyzing income inequality and poverty. This final essay explores the sensitivity in how “income” is defined.
This essay builds on past research that examined the sensitivity of income inequality measures to the definition of income used. In a 2015 study, for instance, it was determined that when income was defined broadly and took into account the size of the economic family, income inequality increased only modestly over an almost three-decade span. Using the latest available data that specifically focuses on the incomes of Canadians, the Canadian Income Survey (CIS), 2022 edition, we’re able to update the earlier results. (It’s important to note that Statistics Canada has replaced the older Survey of Consumer Finances (SCF) and the Survey of Labour and Income Dynamics (SLID) with the CIS. According to Statistics Canada, the newer survey and resulting database improve “data accuracy and reduce respondent burden through administrative (tax filer) data.”)
We have four decades of data to examine. We’re principally interested in the differences in the levels of inequality produced by the different definitions of income as well as the trend. The first definition of income is earnings, which includes wages, salaries and commissions, and net income from self-employment. Since not every economic family will have earnings (retired, unemployed and social assistance recipients, for example), we would expect this type of income to have the most unequal distribution, in other words the highest degree of inequality.
Next, we have total income (from all sources). This is a broader definition of income than earnings and includes pensions, investment income and social assistance from government. This latter point is critical in that total income includes income transfers from government. We would expect this category to be somewhat more equal because almost all Canadians are likely to have some source of income (e.g. pensions, employment insurance and social assistance).
We then subtract income taxes from total income to determine after-tax income (which is a good proxy for “disposable income”). Canada’s progressive income tax system (in which most lower-income families pay little or no income taxes) means we expect this category of income (i.e. after-tax income) will be even more equally distributed. In other words, by taking into consideration how the income tax system increases the burden of income taxes as one’s income increases, thus reducing inequality, we expect the measured levels of inequality to be lower than for either earnings or total income.
Finally, we adjust family after-tax income for family size as explained in a previous essay in this series. We expect this adjusted income will be the most equally distributed. Recall from a previous essay that adjusting for family size is essential to more accurately measure economic wellbeing.
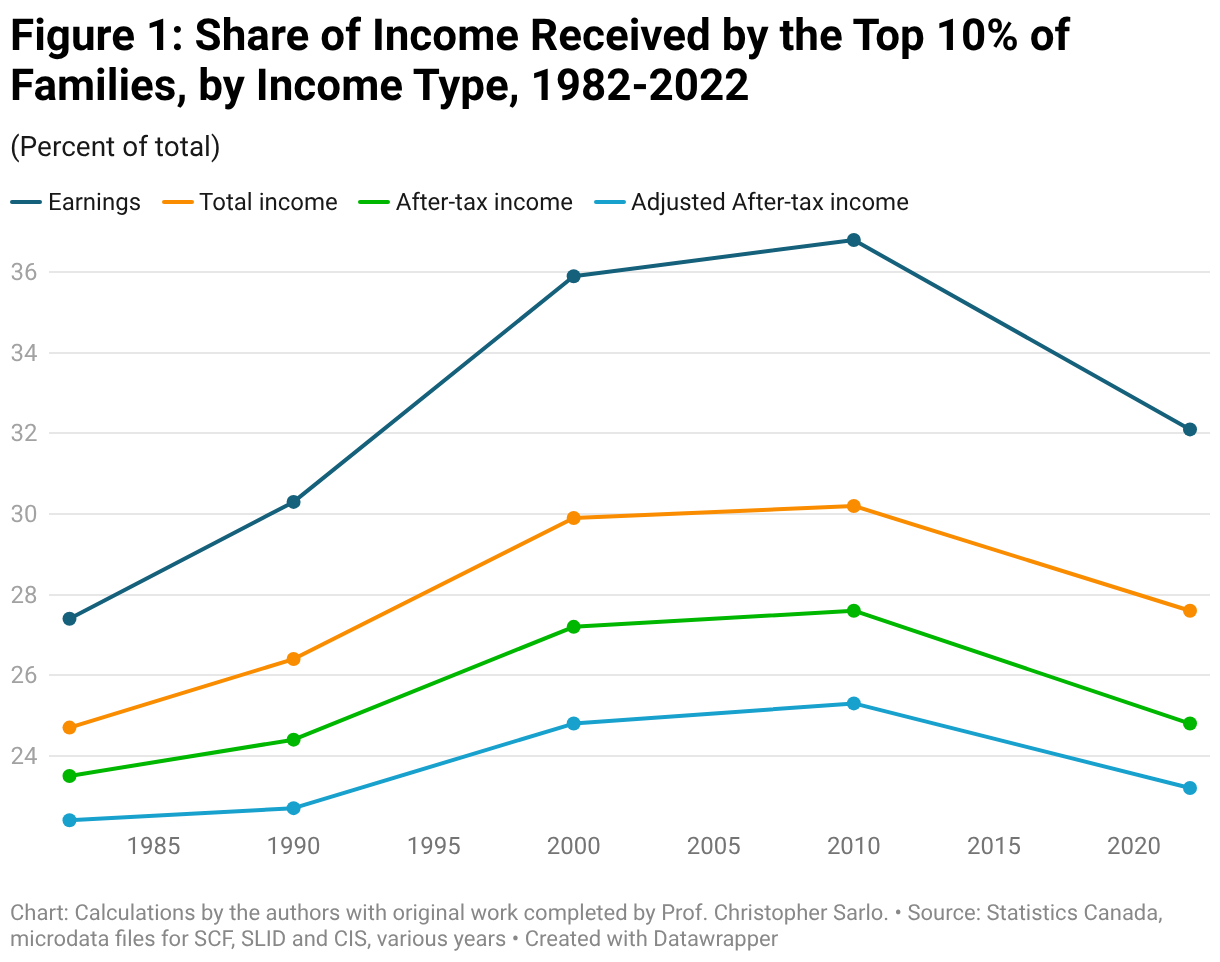
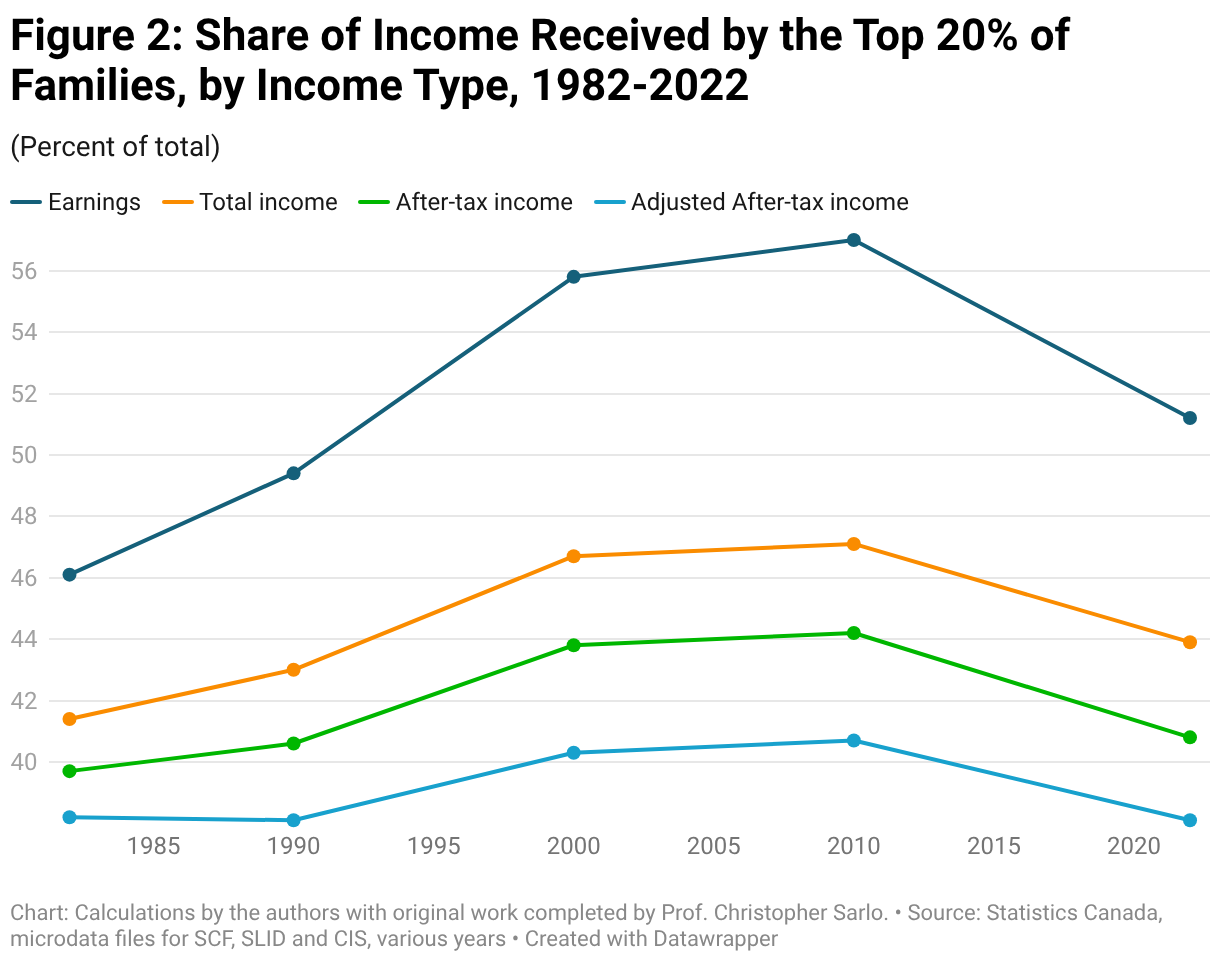
The first two charts below illustrate two different measures of income inequality over a 40-year period for all four definitions of income. Figure 1 examines the share of income received by the 10 per cent of families while Figure 2 examines the share of income received by the top 20 per cent of families. There are a number of important insights here.
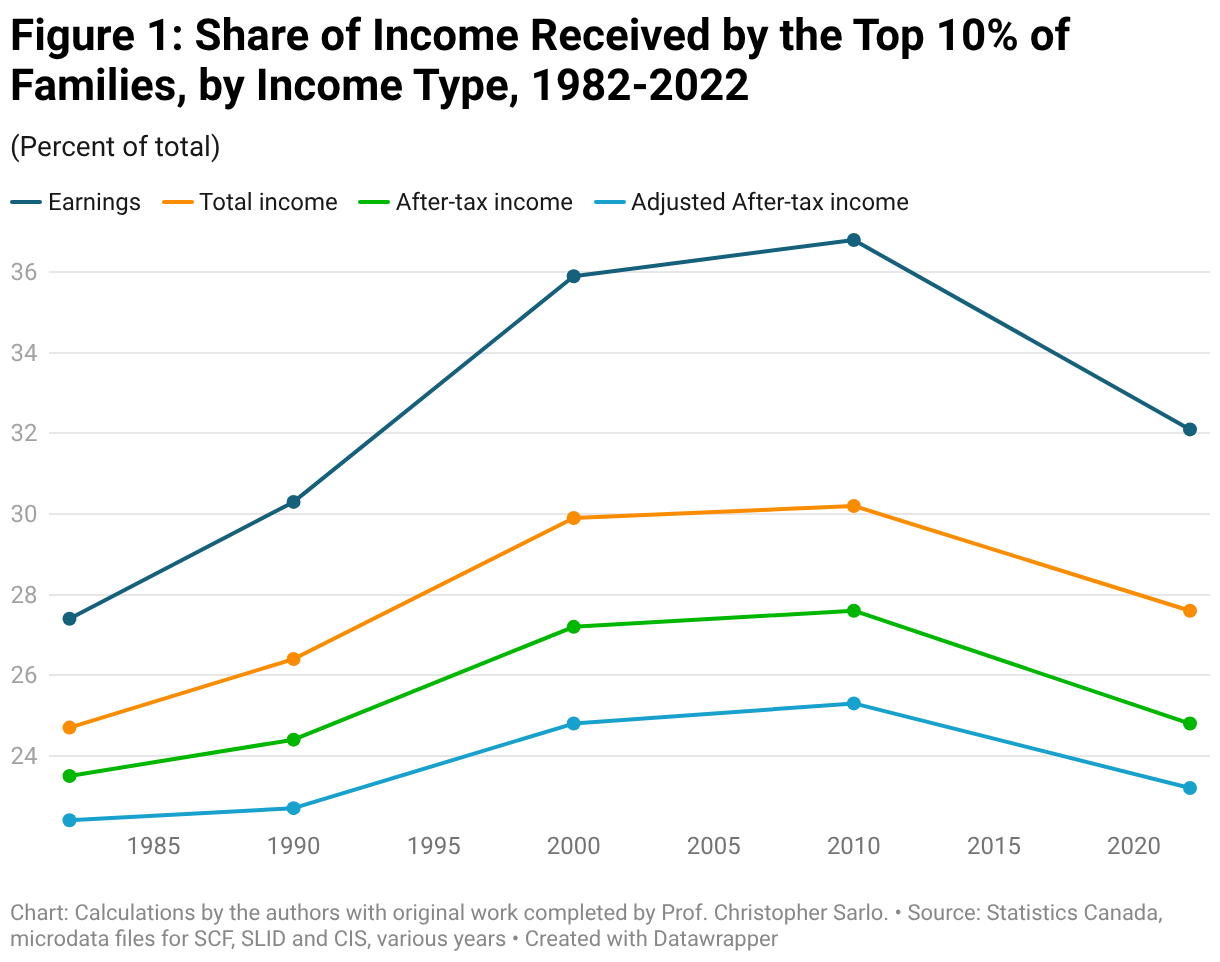
First, the narrowest measure of income (earnings) shows the highest level of inequality regardless of what year is examined. In 2022, the most recent year available, the top 10 per cent of families (Figure 1) received 32.1 per cent of all earnings compared to 27.6 per cent of total income, 24.8 per cent of after-tax income, and 23.2 per cent of adjusted after-tax income. Put differently, the share of income received by the top 10 per cent of families declines from 32.1 per cent of earnings to 23.2 per cent of adjusted after-tax income based solely on the change in the definition of income.
Similar results exist when looking at the share of income received by the top 20 per cent of families. Specifically, their share of income declines from 51.2 per cent for earnings in 2022 to 43.9 per cent for total income, to 40.8 per cent for after-tax income, to 38.1 per cent of adjusted after-tax income.
Perhaps most striking though is that when we focus on a broad measure of income—which includes government transfers, the effects of Canada’s progressive income tax system, and adjustment for family size—income inequality has not changed over the last 40 years. This insight likely runs counter to much of what readers have been exposed to in the media and in general conversation.
It’s also noteworthy that the gradual upward trend in the level of income inequality (for all four definitions of income) observed in the charts above from 1982 to 2010 is broken with the addition of the newest data for 2022. In other words, the levels of income inequality for all four income definitions declined based on the most recent data (2022).
The third chart below illustrates this insight related to changes in income inequality from Figures 1 and 2. Figure 3 specifically shows the percentage point change in income inequality between 1982 and 2022 for all four definitions of income and for both the top 10 per cent and 20 per cent of families. Two insights emerge from all three charts. First, the increase in income inequality is highest, roughly five percentage points, for the narrowest definition of income (earnings). The increases in the share of earnings received by the top 10 per cent and 20 per cent of families were 4.7 percentage points and 5.1 percentage points, respectfully.
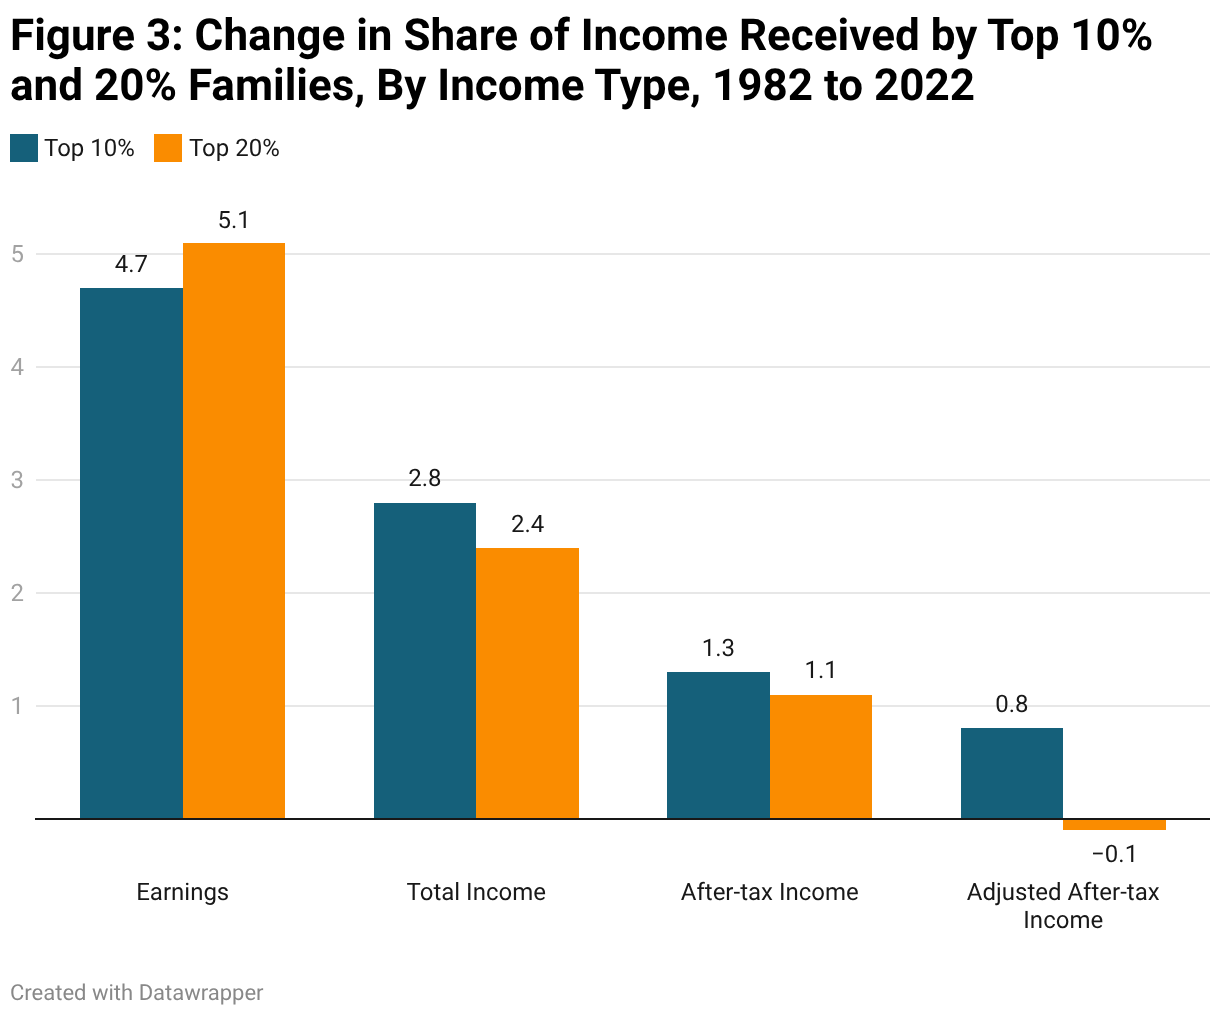
As the definition of income is expanded to include other sources of income including government transfers, and then the effect of income taxes and then finally adjusting for family size, we observe steady decreases in the increases in measured income inequality (Figure 3). For instance, the change in income inequality as measured by the share of income received by the top 10 per cent of families falls from 4.7 percentage points to just 0.8 percentage points, indicating almost no real change over the four decades covered in the data. Similarly, income inequality actually decreases slightly over the four decades for the top 20 per cent of families when examining adjusted after-tax income (-0.1 per cent).
In discussing and thinking about income inequality, it’s important to recognize how the definition of income can result in fairly different conclusions. However, regardless of the definition of income, it’s clear from the newest data that the levels of income inequality declined. Moreover, if we properly adjust for a broader definition of income, the effect of progressive income taxes and adjustment for family size, income inequality has essentially remained unchanged for the past 40 years.
This is the fifth essay in a five-part series on income inequality, which appeared on the Fraser Institute blog. The authors would like to recognize the critical contributions of the authors of the various essays in the 2017 collected series on inequality and poverty as well as Christopher Sarlo’s three decade-plus work on poverty and inequality for the Institute. In addition, the authors thank Christopher Sarlo for his work on early drafts of this series.

By: , and